
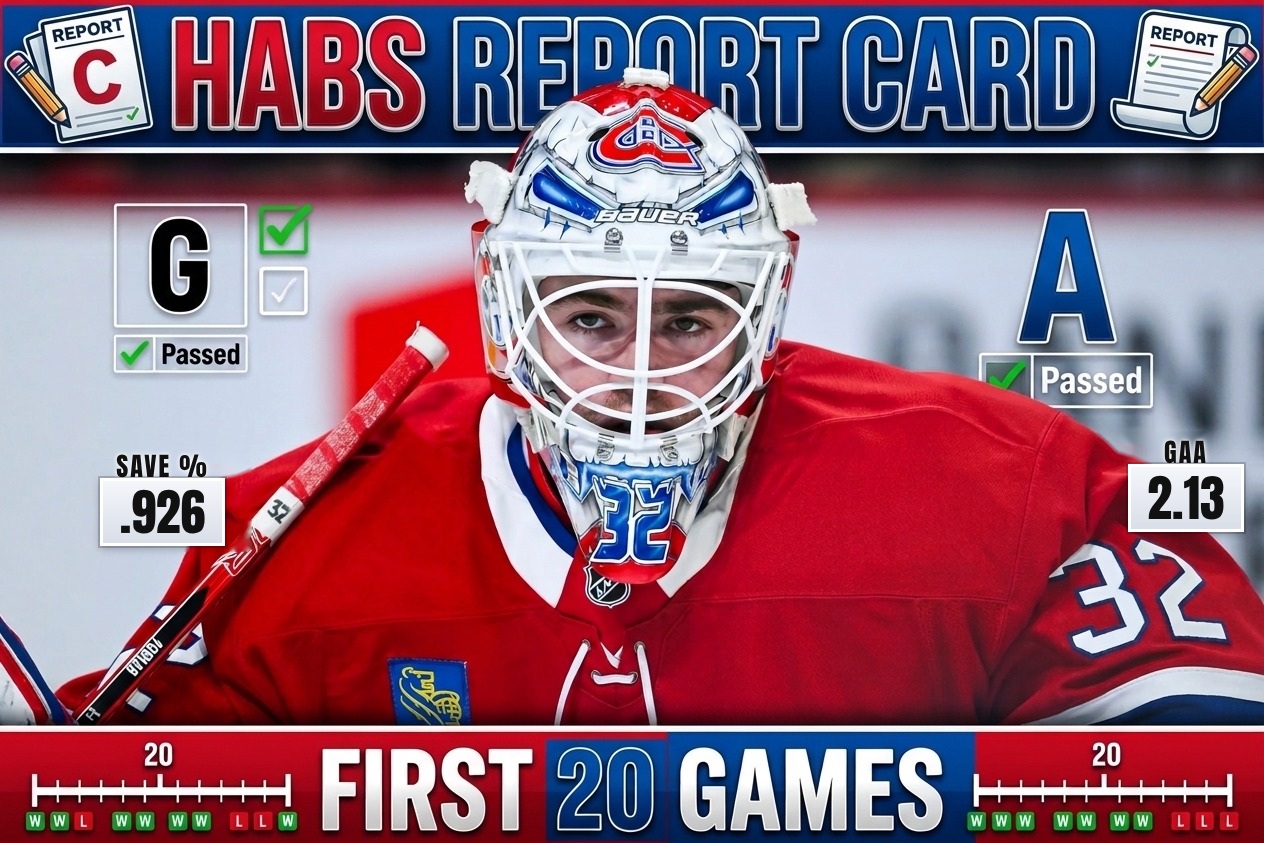
This Canadiens 20-game report card puts the first 10 games next to Games 11 to 20, with the total after 20 on every table. Montreal is 12-4-4 with 28 points, five more than a year ago after 20 games (10-7-3, 23 points), and sits 2nd in the Atlantic Division, 4th in the Eastern Conference and 7th in the NHL. The last ten games were the best stretch of the season on the scoreboard: 7-1-2, 16 of a possible 20 points, and 34 goals for against 26 against. After Game 10 the Canadiens were 5-3-2 with 12 points and 17th in the league.
Underneath the record there is a twist. In the first 10 games Montreal controlled the play (56.8% of the 5-on-5 shot attempts, 2nd in the NHL) and the results lagged. In Games 11 to 20 the results arrived and the play slipped: the attempt share fell to 46.6% (29th in the NHL) and the Canadiens were outshot 306-260, and they won on a 5-on-5 shooting percentage of 13.9% (1st) and a save percentage of 94.4% (3rd), a PDO of 108.4. That number does not last, so this card grades the wins and also looks at what is behind them. Nick Suzuki missed Games 10 to 15 and came back for Game 16, Mike Matheson has missed 11 of the 20 games, and Ivan Demidov has still played only two.
Note: this report covers Games 1 to 20 (Sept. 29 to Nov. 14, 2026). Games 1 to 10 are the numbers from our 10-game report card. Games 21 and later are not included. Jayden Struble played three games before he was traded to Nashville and is not graded.
The 20 Games
| # | Date | Opponent | Result | Shots (MTL-opp) | Goalie (saves/shots) |
|---|---|---|---|---|---|
| 1 | Sept. 29 | at Toronto | W 3-2 | 24-28 | Dobeš 26/28 |
| 2 | Oct. 3 | at Pittsburgh | OTL 5-6 (OT) | 25-30 | Dobeš 24/30 |
| 3 | Oct. 6 | vs Carolina | L 4-6 | 20-33 | Dobeš 27/32 |
| 4 | Oct. 8 | vs Nashville | L 2-5 | 33-20 | Fowler 15/18 |
| 5 | Oct. 10 | vs Detroit | W 1-0 (SO) | 30-30 | Fowler 30/30 |
| 6 | Oct. 13 | vs Buffalo | W 4-3 (SO) | 38-16 | Fowler 13/16 |
| 7 | Oct. 14 | at Washington | L 4-5 | 29-24 | Dobeš 19/24 |
| 8 | Oct. 17 | vs Buffalo | W 4-3 (OT) | 34-26 | Fowler 23/26 |
| 9 | Oct. 20 | vs San Jose | OTL 3-4 (OT) | 34-30 | Dobeš 26/30 |
| 10 | Oct. 23 | at Chicago | W 4-1 | 28-21 | Fowler 20/21 |
| 11 | Oct. 25 | at Winnipeg | W 2-1 | 21-34 | Fowler 33/34 |
| 12 | Oct. 27 | at St. Louis | W 2-0 | 21-46 | Fowler 46/46 |
| 13 | Oct. 29 | at Dallas | W 5-2 | 21-19 | Dobeš 17/19 |
| 14 | Oct. 31 | vs Pittsburgh | W 5-4 | 27-29 | Fowler 25/29 |
| 15 | Nov. 3 | vs Winnipeg | OTL 4-5 (OT) | 22-47 | Fowler 42/47 |
| 16 | Nov. 5 | vs Utah | W 5-4 (OT) | 35-20 | Dobeš 16/20 |
| 17 | Nov. 7 | at Toronto | W 4-2 | 28-28 | Fowler 26/28 |
| 18 | Nov. 10 | vs Minnesota | OTL 1-2 (OT) | 28-24 | Fowler 22/24 |
| 19 | Nov. 12 | at Boston | W 5-2 | 31-32 | Fowler 30/32 |
| 20 | Nov. 14 | vs Colorado | L 1-4 | 26-27 | Dobeš 23/26 |
Shots are shots on goal in regulation and overtime. Saves and shots for the goalies exclude shootout attempts. Click an opponent to open that game’s recap page.
Team Stats
| Category | 2026-27 | 2025-26 | ||
|---|---|---|---|---|
| Games 1-10 | Games 11-20 | Total after 20 (NHL rank) | First 20 games | |
| Standing (Atlantic / Eastern Conference / NHL) | 5th / 9th / 17th | — | 2nd / 4th / 7th | 6th / 13th / 22nd |
| Record (W-L-OTL) | 5-3-2 | 7-1-2 | 12-4-4 | 10-7-3 |
| Regulation wins (RW) | 2 (T-25th) | 6 (T-5th) | 8, T-15th | 5 |
| Points | 12 | 16 | 28 | 23 |
| Point percentage | .600 (12th) | .800 (5th) | .700, T-5th | .575 |
| Goals for | 34 (3.40), 10th | 34 (3.40), 12th | 68 (3.40), 10th | 67 (3.35) |
| Goals against | 35 (3.50), 26th | 26 (2.60), 6th | 61 (3.05), 17th | 74 (3.70) |
| Goal differential | -1, 19th | +8, T-8th | +7, 12th | -7 |
| Power play | 12.5% (4 for 32), 28th | 14.3% (4 for 28), T-28th | 13.3% (8 for 60), 31st | 22.0% (13 for 59) |
| Penalty kill | 81.0% (34 for 42), 13th | 74.3% (26 for 35), T-18th | 77.9% (60 for 77), 16th | 76.8% (53 for 69) |
| Faceoff win % | 53.7%, 4th | 51.4%, 12th | 52.5%, 8th | 51.1% |
| Shots for per game | 29.5, 9th | 26.0, 27th | 27.8, 15th | 25.4 |
| Shots against per game | 25.8, 12th | 30.6, 30th | 28.2, 21st | 26.7 |
| Minor penalties taken | 51 (5.1), 32nd (most) | 39 (3.9), 26th | 90 (4.5), 32nd (most) | 84 (4.2) |
| Times shorthanded per game | 4.2, 32nd (most) | 3.5, T-26th | 3.9, 30th | 3.5 |
| Penalties drawn per game | 4.4, 7th | 3.7, T-18th | 4.1, 12th | 4.2, 13th |
| Net penalties (drawn minus taken) | -11, 32nd (worst) | -6, T-25th | -17, 31st | -9, 26th |
| Giveaways per 60 minutes | 14.2, 6th (fewest) | 15.6, 21st | 14.9, 10th | 13.2, 2nd |
| Hits per 60 minutes | 20.1, 23rd | 20.2, T-20th | 20.1, 22nd | 20.5, 15th |
| 5-on-5 goals (for-against) | 20-21, 16th | 27-12, T-2nd (goal share) | 47-33, 5th (goal share) | 45-45 |
| 5-on-5 shot attempts % | 56.8%, 2nd | 46.6%, 29th | 51.5%, 9th | — |
| 5-on-5 shots on goal % | 54.0%, 4th | 47.3% | 50.6% | — |
| 5-on-5 shooting % | 9.2%, 17th | 13.9%, 1st | 11.4%, 6th | 11.2%, 4th |
| 5-on-5 save % | 88.6%, 26th | 94.4%, 3rd | 91.8%, 6th | 88.5%, 29th |
| 5-on-5 PDO (shooting % plus save %) | 97.8 | 108.4, 1st | 103.2, 4th | — |
| 5-on-5 expected goals % (MoneyPuck) | 54.3%, 6th | 47.8%* | 50.9%, 15th | — |
| 5-on-5 expected goals for (MoneyPuck) | 21.6, 11th | 20.5* | 42.1, 12th | — |
| 5-on-5 expected goals against (MoneyPuck) | 18.2, 7th (fewest) | 22.3* | 40.5, 16th | — |
| 5-on-5 goals against minus expected (MoneyPuck) | +2.8, 26th | -10.3* | -7.5, 4th | — |
Rank is among the 32 teams on a per-game basis, 1st being best. The Games 1-10 column is exactly as published in our 10-game report card, including its ranks. Ranks in the Games 11-20 column are for that ten-game window only, and the rank column after the total is for all 20 games. Last year’s comparison column is the first 20 games of 2025-26; categories left blank were not part of that data. The 5-on-5 attempt and shot counts come from the play-by-play of the 20 games, and the ranks next to them come from the NHL’s own 5-on-5 data. The 5-on-5 goal ranks for Games 11-20 and the total are by the NHL’s 5-on-5 goal share. *MoneyPuck’s Games 11-20 expected-goal numbers are the 20-game total minus the Games 1-10 numbers we published, so they have no rank of their own.
What the Numbers Tell Us
Start with the swing. In the first 10 games Montreal had 56.8% of the 5-on-5 attempts (2nd in the NHL) and went 5-3-2. In Games 11 to 20 the share dropped to 46.6% (29th), the Canadiens were outshot 306-260 across all situations, and the record was 7-1-2. Over the 20 games Montreal has 51.5% of the 5-on-5 attempts (9th in the NHL) and is almost exactly even on shots on goal (555 for, 564 against). That is an average team in territory with a standings line that says elite, and something has to be making up the difference.
That something is finishing and goaltending. In Games 11 to 20 the team scored on 13.9% of its 5-on-5 shots on goal (1st in the NHL) and its goalies stopped 94.4% (3rd), a PDO of 108.4, the best in the league over that stretch. At 5-on-5 the Canadiens outscored opponents 27-12 in those ten games after going 20-21 in the first ten. Over 20 games the 5-on-5 goals are 47-33, the PDO is 103.2 (4th), and MoneyPuck’s expected goals say 42.1 for and 40.5 against, a 50.9% share (15th). Montreal has allowed 7.5 fewer 5-on-5 goals than the chances were worth, the 4th-best gap in the league, and that is the part most likely to shrink. A team at 103.2 PDO with a 50.9% expected-goals share is a good team, not an elite one. The record is real, but the ten games at 108.4 are not repeatable.
The offense is steady, and its shape changed. Montreal scored 3.40 goals per game in both ten-game blocks (10th in the NHL over 20 games; last year’s first 20 was 3.35), but shots for dropped from 29.5 to 26.0 per game (27th in Games 11 to 20), so the goals now come from a higher shooting percentage on fewer shots. The defense is the opposite: goals against fell from 3.50 to 2.60 per game (6th in Games 11 to 20) while shots against rose from 25.8 to 30.6 (30th). After 20 games it is 3.05 goals against per game (17th) and 28.2 shots against (21st), compared with 3.70 goals against per game at this point last year.
Jacob Fowler is the main reason the goals-against number came down. In Games 11 to 20 he went 5-0-2 with a .933 save percentage and a 2.27 goals-against average in seven starts, including a 46-save shutout in St. Louis on Oct. 27 and 42 saves in the overtime loss to Winnipeg. Over 20 games he is 9-1-2 with a .926 and two shutouts. Jakub Dobeš went 2-1-0 with a .862 in three starts and is 3-3-2 with a .852 on the season.
Special teams tell the other half of the story. The power play went 4 for 28 (14.3%) in Games 11 to 20 and is 8 for 60 (13.3%) after 20 games, 31st in the NHL, after finishing last year’s first 20 at 22.0%. The penalty kill went the other way and slipped: 81.0% in the first ten games and 74.3% (26 for 35) in the next ten, 77.9% (16th) overall. The penalties came down but are still too many. Montreal took 39 minors in Games 11 to 20 (3.9 per game, 26th) after 51 in the first ten, and the 90 minors after 20 games are still the most in the NHL, with a net penalty count of -17 (31st).
One more number puts the 12-4-4 record in perspective. Eight of the 12 wins came in regulation, up from 2 of 5 after ten games. The other four needed extra time: shootout wins over Detroit and Buffalo, an overtime win over Buffalo, and an overtime win over Utah on Nov. 5. Montreal is 4-0-4 in the eight games that went past regulation, so it has taken at least a point in every one of them. Regulation wins are the first tiebreaker in the NHL standings, and 8 of them is tied for 15th in the league on a per-game basis, which is the part of the record that still has room to grow.
Canadiens Stats (Situational)
| Situation | Record (W-L-OTL) | Goals for – against | Shots for – against | Shots per game (for – against) |
|---|---|---|---|---|
| Home, Games 1-10 (6 GP) | 3-2-1 | 18-21 | 189-155 | 31.5 – 25.8 |
| Home, Games 11-20 (5 GP) | 2-1-2 | 16-19 | 138-147 | 27.6 – 29.4 |
| Home, Total after 20 (11 GP) | 5-3-3 | 34-40 | 327-302 | 29.7 – 27.5 |
| Road, Games 1-10 (4 GP) | 2-1-1 | 16-14 | 106-103 | 26.5 – 25.8 |
| Road, Games 11-20 (5 GP) | 5-0-0 | 18-7 | 122-159 | 24.4 – 31.8 |
| Road, Total after 20 (9 GP) | 7-1-1 | 34-21 | 228-262 | 25.3 – 29.1 |
| Overall, Games 1-10 (10 GP) | 5-3-2 | 34-35 | 295-258 | 29.5 – 25.8 |
| Overall, Games 11-20 (10 GP) | 7-1-2 | 34-26 | 260-306 | 26.0 – 30.6 |
| Overall, Total after 20 (20 GP) | 12-4-4 | 68-61 | 555-564 | 27.8 – 28.2 |
Game States
| State | GP 1-10 | GP 11-20 | Total after 20 |
|---|---|---|---|
| Montreal scored first | 3 GP, 0-2-1 | 6 GP, 5-0-1 | 9 GP, 5-2-2 |
| Opponent scored first | 6 GP, 4-1-1 | 4 GP, 2-1-1 | 10 GP, 6-2-2 |
| Scoreless game that went to a shootout | 1 GP, 1-0-0 | 0 GP | 1 GP, 1-0-0 |
| Leading after one period | 2 GP, 1-1-0 | 4 GP, 3-0-1 | 6 GP, 4-1-1 |
| Tied after one period | 8 GP, 4-2-2 | 5 GP, 4-0-1 | 13 GP, 8-2-3 |
| Trailing after one period | 0 GP | 1 GP, 0-1-0 | 1 GP, 0-1-0 |
| Leading after two periods | 5 GP, 4-0-1 | 7 GP, 6-0-1 | 12 GP, 10-0-2 |
| Tied after two periods | 3 GP, 1-2-0 | 1 GP, 0-0-1 | 4 GP, 1-2-1 |
| Trailing after two periods | 2 GP, 0-1-1 | 2 GP, 1-1-0 | 4 GP, 1-2-1 |
| One-goal games | 7 GP, 4-1-2 | 5 GP, 3-0-2 | 12 GP, 7-1-4 |
| Games past regulation | 5 GP, 3-0-2 | 3 GP, 1-0-2 | 8 GP, 4-0-4 |
Scoring by Period
| Period | Canadiens, Games 1-10 | Canadiens, Games 11-20 | Canadiens, Total | Opponents, Games 1-10 | Opponents, Games 11-20 | Opponents, Total |
|---|---|---|---|---|---|---|
| 1st | 12 | 13 | 25 | 10 | 7 | 17 |
| 2nd | 12 | 13 | 25 | 10 | 4 | 14 |
| 3rd | 7 | 7 | 14 | 13 | 13 | 26 |
| Overtime | 1 | 1 | 2 | 2 | 2 | 4 |
| Shootout | 2 | 0 | 2 | 0 | 0 | 0 |
| Total | 34 | 34 | 68 | 35 | 26 | 61 |
Shots per Period
| Period | Canadiens, Games 1-10 | Canadiens, Games 11-20 | Canadiens, Total | Opponents, Games 1-10 | Opponents, Games 11-20 | Opponents, Total |
|---|---|---|---|---|---|---|
| 1st | 89 | 95 | 184 | 86 | 82 | 168 |
| 2nd | 105 | 88 | 193 | 90 | 104 | 194 |
| 3rd | 91 | 75 | 166 | 76 | 115 | 191 |
| Overtime | 10 | 2 | 12 | 6 | 5 | 11 |
| Total | 295 | 260 | 555 | 258 | 306 | 564 |
The shootout row counts the winning shootout goals against Detroit and Buffalo in the first ten games, there were no shootouts in Games 11 to 20, and the totals match the official standings (68 for, 61 against). The biggest change in how the games are going is who scores first. Montreal scored first in six of the last ten games and went 5-0-1 in them, after scoring first in only three of the first ten (0-2-1). It is 10-0-2 when leading after two periods, and 7-1-4 in one-goal games.
The third period is still the problem. Montreal was outshot 115-75 in the third in Games 11 to 20 (it was ahead 91-76 in the first ten) and outscored 13-7, the same 13 goals against as in the first ten. One of the goals against was an empty-netter (Colorado), and one of the goals for was into an empty net, so it is 12-6 without them. The 26 goals against in third periods after 20 games are the most of any period (17 in the first, 14 in the second), and the Canadiens have scored only 14. The lead is not the issue, since they win when ahead after two, but a game like Winnipeg on Nov. 3 shows what sits behind that number: Montreal led 3-0 after two periods, gave up four goals in the third and lost 5-4 in overtime.
Players Stats
Each table shows this season’s Games 1 to 10, Games 11 to 20 and the total after 20 games, against the first 20 games of last season. Players with no 2025-26 row were not with the Canadiens at that point last season.
Nick Suzuki
| GP | G | A | PTS | +/- | PIM | SOG | S% | TOI/GP | |
|---|---|---|---|---|---|---|---|---|---|
| 2026-27, Games 1-10 | 9 | 5 | 7 | 12 | +6 | 2 | 26 | 19.2 | 21:47 |
| 2026-27, Games 11-20 | 5 | 3 | 2 | 5 | +4 | 0 | 10 | 30.0 | 19:19 |
| 2026-27, Total (Games 1-20) | 14 | 8 | 9 | 17 | +10 | 2 | 36 | 22.2 | 20:54 |
| 2025-26, first 20 games | 20 | 5 | 17 | 22 | +10 | 4 | 43 | 11.6 | 20:28 |
Suzuki came back from the upper-body injury he suffered against San Jose and played Games 16 to 20 after missing Games 10 to 15. In those five games he scored three goals with two assists (30.0% shooting) in 19:19 a night. After 20 games he has 17 points in 14 games, 1.21 per game against 1.10 a year ago (22 points in 20), and his +10 matches last year’s +10 in six fewer games.
Cole Caufield
| GP | G | A | PTS | +/- | PIM | SOG | S% | TOI/GP | |
|---|---|---|---|---|---|---|---|---|---|
| 2026-27, Games 1-10 | 10 | 6 | 2 | 8 | +3 | 6 | 36 | 16.7 | 19:20 |
| 2026-27, Games 11-20 | 10 | 6 | 5 | 11 | +3 | 4 | 31 | 19.4 | 17:33 |
| 2026-27, Total (Games 1-20) | 20 | 12 | 7 | 19 | +6 | 10 | 67 | 17.9 | 18:26 |
| 2025-26, first 20 games | 20 | 13 | 8 | 21 | +8 | 8 | 55 | 23.6 | 18:29 |
Six goals and five assists in Games 11 to 20 put Caufield at 12 goals and 19 points, the most on the team, and he has 67 shots (3.35 a game), 20 more than any other Canadien. Last year he had 13 goals and 21 points in the same 20 games. His ice time dropped from 19:20 to 17:33 a night in the last ten, and he was on the ice for more attempts against than for at 5-on-5 in that stretch (126-140).
Juraj Slafkovský
| GP | G | A | PTS | +/- | PIM | SOG | S% | TOI/GP | |
|---|---|---|---|---|---|---|---|---|---|
| 2026-27, Games 1-10 | 10 | 2 | 5 | 7 | 0 | 12 | 27 | 7.4 | 18:35 |
| 2026-27, Games 11-20 | 10 | 0 | 6 | 6 | +1 | 6 | 20 | 0.0 | 18:01 |
| 2026-27, Total (Games 1-20) | 20 | 2 | 11 | 13 | +1 | 18 | 47 | 4.3 | 18:18 |
| 2025-26, first 20 games | 20 | 6 | 3 | 9 | +3 | 16 | 44 | 13.6 | 17:44 |
No goals in Games 11 to 20 on 20 shots, but six assists. Two goals on 47 shots (4.3%) after 20 games is the number to watch, compared with 6 goals on 44 shots over the same stretch last year. His 13 points are four more than last year, so the passing is there and the finish is not.
Josh Anderson
| GP | G | A | PTS | +/- | PIM | SOG | S% | TOI/GP | |
|---|---|---|---|---|---|---|---|---|---|
| 2026-27, Games 1-10 | 10 | 4 | 2 | 6 | +2 | 10 | 22 | 18.2 | 13:54 |
| 2026-27, Games 11-20 | 9 | 4 | 2 | 6 | +4 | 12 | 13 | 30.8 | 14:17 |
| 2026-27, Total (Games 1-20) | 19 | 8 | 4 | 12 | +6 | 22 | 35 | 22.9 | 14:05 |
| 2025-26, first 20 games | 20 | 3 | 3 | 6 | -10 | 24 | 20 | 15.0 | 14:52 |
Four more goals in Games 11 to 20 (on only 13 shots) give Anderson 8 goals in 19 games on 35 shots (22.9%), more than double last year’s 3 goals in 20. He missed Game 17. He also leads the forwards with 22 penalty minutes, and the Canadiens had only 38.9% of the 5-on-5 attempts with him on the ice in Games 11 to 20 (77-121).
Zachary Bolduc
| GP | G | A | PTS | +/- | PIM | SOG | S% | TOI/GP | |
|---|---|---|---|---|---|---|---|---|---|
| 2026-27, Games 1-10 | 10 | 4 | 2 | 6 | +2 | 4 | 17 | 23.5 | 13:52 |
| 2026-27, Games 11-20 | 10 | 2 | 1 | 3 | -1 | 0 | 15 | 13.3 | 14:48 |
| 2026-27, Total (Games 1-20) | 20 | 6 | 3 | 9 | +1 | 4 | 32 | 18.8 | 14:20 |
| 2025-26, first 20 games | 20 | 4 | 3 | 7 | -4 | 10 | 28 | 14.3 | 13:42 |
Three points in Games 11 to 20 after six in the first ten, but 9 points in 20 games is already above last year’s 7, with only 4 penalty minutes and 14:20 a night. Bolduc still has the best 5-on-5 attempt share of the regulars after 20 games (57.4%), though all of that came early: 68.0% in Games 1 to 10 and 47.5% in Games 11 to 20.
Chris Kreider
| GP | G | A | PTS | +/- | PIM | SOG | S% | TOI/GP | |
|---|---|---|---|---|---|---|---|---|---|
| 2026-27, Games 1-10 | 10 | 1 | 3 | 4 | -1 | 4 | 9 | 11.1 | 14:38 |
| 2026-27, Games 11-20 | 9 | 2 | 3 | 5 | +5 | 2 | 13 | 15.4 | 11:55 |
| 2026-27, Total (Games 1-20) | 19 | 3 | 6 | 9 | +4 | 6 | 22 | 13.6 | 13:21 |
New this season. Five points (2 goals, 3 assists) in nine games in Games 11 to 20, with a +5 rating, after four points in the first ten. His ice time dropped from 14:38 to 11:55 and he missed Game 20. He has 9 points in 19 games and the Canadiens have outscored opponents 16-10 at 5-on-5 with him on the ice, even though they were out-attempted 215 to 191.
Alex Newhook
| GP | G | A | PTS | +/- | PIM | SOG | S% | TOI/GP | |
|---|---|---|---|---|---|---|---|---|---|
| 2026-27, Games 1-10 | 10 | 1 | 3 | 4 | -5 | 6 | 11 | 9.1 | 16:10 |
| 2026-27, Games 11-20 | 10 | 4 | 2 | 6 | +4 | 6 | 13 | 30.8 | 16:18 |
| 2026-27, Total (Games 1-20) | 20 | 5 | 5 | 10 | -1 | 12 | 24 | 20.8 | 16:14 |
| 2025-26, first 20 games | 17 | 6 | 6 | 12 | +7 | 8 | 24 | 25.0 | 14:38 |
Four goals in Games 11 to 20 on 13 shots (30.8%) after one in the first ten, and the -5 he had after 10 games is now -1. The shot numbers are the other side: Newhook has the lowest 5-on-5 attempt share of any regular after 20 games (44.5%) and was at 36.8% in the last ten. His 10 points compare with 12 in 17 games last year.
Phillip Danault
| GP | G | A | PTS | +/- | PIM | SOG | S% | TOI/GP | |
|---|---|---|---|---|---|---|---|---|---|
| 2026-27, Games 1-10 | 10 | 0 | 3 | 3 | +5 | 0 | 17 | 0.0 | 16:06 |
| 2026-27, Games 11-20 | 10 | 2 | 2 | 4 | -2 | 0 | 12 | 16.7 | 18:08 |
| 2026-27, Total (Games 1-20) | 20 | 2 | 5 | 7 | +3 | 0 | 29 | 6.9 | 17:07 |
Danault scored his first two goals of the season in Games 11 to 20 and added two assists, playing 18:08 a night (two minutes more than in the first ten) and still without a penalty minute after 20 games. The 5-on-5 attempt share fell from 62.7% in the first ten to 44.0% in the last ten, so the checking line is spending more time defending.
Jake Evans
| GP | G | A | PTS | +/- | PIM | SOG | S% | TOI/GP | |
|---|---|---|---|---|---|---|---|---|---|
| 2026-27, Games 1-10 | 10 | 2 | 1 | 3 | -1 | 2 | 9 | 22.2 | 13:55 |
| 2026-27, Games 11-20 | 10 | 1 | 4 | 5 | +4 | 0 | 7 | 14.3 | 17:00 |
| 2026-27, Total (Games 1-20) | 20 | 3 | 5 | 8 | +3 | 2 | 16 | 18.8 | 15:28 |
| 2025-26, first 20 games | 20 | 3 | 3 | 6 | -12 | 2 | 24 | 12.5 | 15:37 |
Four assists and a goal in Games 11 to 20, +4, and a bigger role (17:00 a night, up from 13:55). Eight points in 20 games compare with 6 last year, and the +3 compares with a -12. The Canadiens outscored opponents 10-5 at 5-on-5 with him on the ice in the last ten.
Alexandre Texier
| GP | G | A | PTS | +/- | PIM | SOG | S% | TOI/GP | |
|---|---|---|---|---|---|---|---|---|---|
| 2026-27, Games 1-10 | 10 | 1 | 2 | 3 | -2 | 8 | 14 | 7.1 | 13:02 |
| 2026-27, Games 11-20 | 10 | 1 | 1 | 2 | +1 | 2 | 20 | 5.0 | 13:57 |
| 2026-27, Total (Games 1-20) | 20 | 2 | 3 | 5 | -1 | 10 | 34 | 5.9 | 13:30 |
Two points (1 goal, 1 assist) in Games 11 to 20 on 20 shots (5.0%), and 2 goals on 34 shots (5.9%) after 20 games. MoneyPuck has him at 3.53 expected goals at 5-on-5, the third-most on the team, so the chances are there and the puck is not going in. He has 10 penalty minutes and a -1 rating.
Kirby Dach
| GP | G | A | PTS | +/- | PIM | SOG | S% | TOI/GP | |
|---|---|---|---|---|---|---|---|---|---|
| 2026-27, Games 1-10 | 10 | 0 | 2 | 2 | -4 | 6 | 5 | 0.0 | 9:59 |
| 2026-27, Games 11-20 | 8 | 2 | 3 | 5 | +8 | 4 | 12 | 16.7 | 12:54 |
| 2026-27, Total (Games 1-20) | 18 | 2 | 5 | 7 | +4 | 10 | 17 | 11.8 | 11:17 |
| 2025-26, first 20 games | 15 | 5 | 2 | 7 | -2 | 16 | 22 | 22.7 | 14:01 |
A better second block: Dach scored his first two goals of the season and added three assists in eight games (he missed Games 14 and 15), with a +8 in the block after a -4 in the first ten. The Canadiens outscored opponents 8-0 at 5-on-5 with him on the ice in Games 11 to 20. At 11:17 a night he is still well below last year’s 14:01.
Ivan Demidov
| GP | G | A | PTS | +/- | PIM | SOG | S% | TOI/GP | |
|---|---|---|---|---|---|---|---|---|---|
| 2026-27, Games 1-10 | 2 | 1 | 1 | 2 | 0 | 2 | 4 | 25.0 | 15:37 |
| 2026-27, Games 11-20 | 0 | — | — | — | — | — | — | — | — |
| 2026-27, Total (Games 1-20) | 2 | 1 | 1 | 2 | 0 | 2 | 4 | 25.0 | 15:37 |
| 2025-26, first 20 games | 20 | 4 | 11 | 15 | +1 | 10 | 23 | 17.4 | 14:30 |
Demidov has played two games (Games 1 and 2, with 1 goal and 1 assist) and has been out since Game 3 with a lower-body injury, which means he has missed 18 of the 20 games. Last year he had 15 points in the first 20 games.
Oliver Kapanen
| GP | G | A | PTS | +/- | PIM | SOG | S% | TOI/GP | |
|---|---|---|---|---|---|---|---|---|---|
| 2026-27, Games 1-10 | 3 | 0 | 0 | 0 | -1 | 2 | 5 | 0.0 | 12:25 |
| 2026-27, Games 11-20 | 10 | 1 | 1 | 2 | +6 | 4 | 11 | 9.1 | 11:47 |
| 2026-27, Total (Games 1-20) | 13 | 1 | 1 | 2 | +5 | 6 | 16 | 6.2 | 11:56 |
| 2025-26, first 20 games | 20 | 7 | 4 | 11 | 0 | 4 | 25 | 28.0 | 12:52 |
Kapanen has played every game since Game 8, on the fourth line at 11:47 a night. Two points in ten games, but a +6 rating, and the Canadiens outscored opponents 8-2 at 5-on-5 with him on the ice. Last year he had 11 points in the first 20 games.
Owen Beck
| GP | G | A | PTS | +/- | PIM | SOG | S% | TOI/GP | |
|---|---|---|---|---|---|---|---|---|---|
| 2026-27, Games 1-10 | 3 | 0 | 1 | 1 | -1 | 0 | 4 | 0.0 | 8:23 |
| 2026-27, Games 11-20 | 3 | 1 | 1 | 2 | +1 | 5 | 2 | 50.0 | 9:33 |
| 2026-27, Total (Games 1-20) | 6 | 1 | 2 | 3 | 0 | 5 | 6 | 16.7 | 8:58 |
| 2025-26, first 20 games | 2 | 0 | 0 | 0 | -1 | 0 | 1 | 0.0 | 8:22 |
Played Games 14, 15 and 17 in Games 11 to 20 (1 goal, 1 assist, 9:33 a night). Beck has played six of the 20 games, with 3 points. He had two games and no points in the first 20 last season.
Florian Xhekaj
| GP | G | A | PTS | +/- | PIM | SOG | S% | TOI/GP | |
|---|---|---|---|---|---|---|---|---|---|
| 2026-27, Games 1-10 | 2 | 0 | 0 | 0 | -4 | 0 | 2 | 0.0 | 7:36 |
| 2026-27, Games 11-20 | 6 | 1 | 2 | 3 | +3 | 13 | 8 | 12.5 | 7:54 |
| 2026-27, Total (Games 1-20) | 8 | 1 | 2 | 3 | -1 | 13 | 10 | 10.0 | 7:50 |
Played Games 11 to 15 and Game 20 in Games 11 to 20 with 1 goal and 2 assists, and he took 13 penalty minutes in 7:54 a night. The Canadiens outscored opponents 5-1 at 5-on-5 when he was on the ice in those games.
Lane Hutson
| GP | G | A | PTS | +/- | PIM | SOG | S% | TOI/GP | |
|---|---|---|---|---|---|---|---|---|---|
| 2026-27, Games 1-10 | 10 | 2 | 7 | 9 | +3 | 6 | 21 | 9.5 | 25:58 |
| 2026-27, Games 11-20 | 10 | 1 | 8 | 9 | +2 | 4 | 21 | 4.8 | 23:51 |
| 2026-27, Total (Games 1-20) | 20 | 3 | 15 | 18 | +5 | 10 | 42 | 7.1 | 24:54 |
| 2025-26, first 20 games | 20 | 2 | 15 | 17 | -2 | 0 | 31 | 6.5 | 22:56 |
Hutson has 18 points (3 goals, 15 assists) in 20 games, one more than last year, and a +5 rating that was -2 last year. At 24:54 a night he is still the most-used player on the team, and he is up to 10 penalty minutes after 0 last year. Nine of the points came in Games 11 to 20, all but one of them assists.
Alexandre Carrier
| GP | G | A | PTS | +/- | PIM | SOG | S% | TOI/GP | |
|---|---|---|---|---|---|---|---|---|---|
| 2026-27, Games 1-10 | 10 | 1 | 4 | 5 | +6 | 6 | 11 | 9.1 | 19:52 |
| 2026-27, Games 11-20 | 10 | 0 | 2 | 2 | 0 | 8 | 3 | 0.0 | 21:05 |
| 2026-27, Total (Games 1-20) | 20 | 1 | 6 | 7 | +6 | 14 | 14 | 7.1 | 20:28 |
| 2025-26, first 20 games | 20 | 1 | 6 | 7 | -9 | 8 | 15 | 6.7 | 18:45 |
Seven points after 20 games, the same as last year, but a +6 against last year’s -9. He played 21:05 a night in the last ten with 2 assists and 3 shots, and the team’s 5-on-5 attempt share with him on the ice was 36.8% (111-191), the lowest of any Canadien in Games 11 to 20.
Noah Dobson
| GP | G | A | PTS | +/- | PIM | SOG | S% | TOI/GP | |
|---|---|---|---|---|---|---|---|---|---|
| 2026-27, Games 1-10 | 10 | 0 | 2 | 2 | -4 | 8 | 23 | 0.0 | 21:24 |
| 2026-27, Games 11-20 | 10 | 0 | 6 | 6 | +3 | 6 | 18 | 0.0 | 20:41 |
| 2026-27, Total (Games 1-20) | 20 | 0 | 8 | 8 | -1 | 14 | 41 | 0.0 | 21:02 |
| 2025-26, first 20 games | 20 | 1 | 12 | 13 | +1 | 10 | 35 | 2.9 | 22:50 |
Still no goals after 41 shots, the most among the defensemen. Dobson had six assists in Games 11 to 20 and a +3 after a -4 in the first ten, and the Canadiens outscored opponents 7-3 at 5-on-5 with him on the ice. His 8 points are five fewer than last year and his ice time is down almost two minutes (22:50 to 21:02).
Kaiden Guhle
| GP | G | A | PTS | +/- | PIM | SOG | S% | TOI/GP | |
|---|---|---|---|---|---|---|---|---|---|
| 2026-27, Games 1-10 | 6 | 1 | 2 | 3 | +1 | 4 | 9 | 11.1 | 22:10 |
| 2026-27, Games 11-20 | 10 | 1 | 2 | 3 | +6 | 6 | 10 | 10.0 | 23:16 |
| 2026-27, Total (Games 1-20) | 16 | 2 | 4 | 6 | +7 | 10 | 19 | 10.5 | 22:51 |
| 2025-26, first 20 games | 5 | 1 | 1 | 2 | +1 | 7 | 7 | 14.3 | 19:14 |
Guhle has played every game since Game 5 (16 of 20) and is at 22:51 a night, behind only Hutson (24:54) and Matheson (23:28, in nine games). He has 6 points and a +7. The 5-on-5 goals are 10-3 for Montreal with him on the ice in Games 11 to 20, while the attempts were 134-207 against (39.3%), which is a gap to keep in mind.
Mike Matheson
| GP | G | A | PTS | +/- | PIM | SOG | S% | TOI/GP | |
|---|---|---|---|---|---|---|---|---|---|
| 2026-27, Games 1-10 | 6 | 1 | 1 | 2 | -2 | 6 | 12 | 8.3 | 23:30 |
| 2026-27, Games 11-20 | 3 | 0 | 3 | 3 | +6 | 0 | 4 | 0.0 | 23:24 |
| 2026-27, Total (Games 1-20) | 9 | 1 | 4 | 5 | +4 | 6 | 16 | 6.2 | 23:28 |
| 2025-26, first 20 games | 20 | 4 | 8 | 12 | +9 | 14 | 25 | 16.0 | 24:50 |
Matheson played Games 11, 12 and 19 in Games 11 to 20 (3 assists, +6, 23:24 a night). He has missed 11 of the 20 games and is day to day. Last year he had 12 points and a +9 in the first 20 games.
Arber Xhekaj
| GP | G | A | PTS | +/- | PIM | SOG | S% | TOI/GP | |
|---|---|---|---|---|---|---|---|---|---|
| 2026-27, Games 1-10 | 10 | 0 | 0 | 0 | -2 | 16 | 5 | 0.0 | 11:59 |
| 2026-27, Games 11-20 | 9 | 1 | 3 | 4 | +3 | 16 | 9 | 11.1 | 12:21 |
| 2026-27, Total (Games 1-20) | 19 | 1 | 3 | 4 | +1 | 32 | 14 | 7.1 | 12:09 |
| 2025-26, first 20 games | 19 | 0 | 1 | 1 | -5 | 30 | 16 | 0.0 | 11:29 |
Four points (1 goal, 3 assists) in Games 11 to 20 after none in the first ten, with a +3. He missed Game 12. His 32 penalty minutes are the most on the team (30 in the same stretch last year), and the 12:09 a night is a bit more than last year’s 11:29.
Adam Engström
| GP | G | A | PTS | +/- | PIM | SOG | S% | TOI/GP | |
|---|---|---|---|---|---|---|---|---|---|
| 2026-27, Games 1-10 | 5 | 0 | 0 | 0 | +2 | 0 | 5 | 0.0 | 11:24 |
| 2026-27, Games 11-20 | 8 | 1 | 1 | 2 | +4 | 2 | 8 | 12.5 | 11:29 |
| 2026-27, Total (Games 1-20) | 13 | 1 | 1 | 2 | +6 | 2 | 13 | 7.7 | 11:27 |
Engström played eight of the ten games in Games 11 to 20 (he sat out Games 11 and 19) with 1 goal and 1 assist and a +4. He has 13 games played and a +6, and the Canadiens outscored opponents 9-4 at 5-on-5 with him on the ice in Games 11 to 20, in 11:29 a night.
David Reinbacher
| GP | G | A | PTS | +/- | PIM | SOG | S% | TOI/GP | |
|---|---|---|---|---|---|---|---|---|---|
| 2026-27, Games 1-10 | 1 | 0 | 0 | 0 | -1 | 0 | 1 | 0.0 | 9:09 |
| 2026-27, Games 11-20 | 0 | — | — | — | — | — | — | — | — |
| 2026-27, Total (Games 1-20) | 1 | 0 | 0 | 0 | -1 | 0 | 1 | 0.0 | 9:09 |
Played one game (Game 8) for 9:09. He is with the Rocket.
Goaltenders
| GP | W-L-OTL | GAA | SV% | Shots against | Saves | SO | |
|---|---|---|---|---|---|---|---|
| Jakub Dobeš (2026-27, Games 1-10) | 5 | 1-2-2 | 4.47 | .847 | 144 | 122 | 0 |
| Jakub Dobeš (2026-27, Games 11-20) | 3 | 2-1-0 | 3.04 | .862 | 65 | 56 | 0 |
| Jakub Dobeš (2026-27, Total) | 8 | 3-3-2 | 3.93 | .852 | 209 | 178 | 0 |
| Jakub Dobeš (2025-26, first 20 team games) | 10 | 6-2-2 | 2.96 | .892 | 260 | 232 | 0 |
| Jacob Fowler (2026-27, Games 1-10) | 5 | 4-1-0 | 1.94 | .910 | 111 | 101 | 1 |
| Jacob Fowler (2026-27, Games 11-20) | 7 | 5-0-2 | 2.27 | .933 | 240 | 224 | 1 |
| Jacob Fowler (2026-27, Total) | 12 | 9-1-2 | 2.13 | .926 | 351 | 325 | 2 |
Dobeš started Games 13, 16 and 20 and stopped 17 of 19, 16 of 20 and 23 of 26. Fowler started the other seven games in Games 11 to 20 (Games 11, 12, 14, 15, 17, 18 and 19) and stopped 33 of 34, 46 of 46 (a shutout in St. Louis), 25 of 29, 42 of 47, 26 of 28, 22 of 24 and 30 of 32.
Analytics: 5-on-5 On-Ice Numbers
These numbers show what happened at 5-on-5 across all 20 games. CF and CA are the shot attempts for and against (goals, shots on goal, misses and blocks) while the player was on the ice, and CF% is the share Montreal had; the first two CF% columns show how that share changed from Games 1-10 to Games 11-20. GF and GA are the goals for and against while he was on the ice. G is the player’s own 5-on-5 goals, and xG is his own 5-on-5 expected goals from MoneyPuck: every shot he took is valued by where it came from and what kind of shot it was, so xG shows how many goals his chances were worth. When G is well above xG he is finishing hot, and when G is below xG the puck is not going in as often as it should. Everything except xG is counted from the NHL play-by-play and shift data for the 20 games.
| Player | GP | CF%, GP 1-10 | CF%, GP 11-20 | CF | CA | CF%, Total | GF | GA | GF% | G | xG |
|---|---|---|---|---|---|---|---|---|---|---|---|
| Zachary Bolduc | 20 | 68.0% | 47.5% | 245 | 182 | 57.4% | 8 | 3 | 72.7% | 3 | 2.37 |
| Lane Hutson | 20 | 62.4% | 51.8% | 432 | 323 | 57.2% | 18 | 12 | 60.0% | 2 | 1.60 |
| Nick Suzuki | 14 | 58.9% | 51.3% | 228 | 179 | 56.0% | 12 | 4 | 75.0% | 4 | 2.73 |
| Noah Dobson | 20 | 56.1% | 53.2% | 352 | 292 | 54.7% | 11 | 12 | 47.8% | 0 | 1.57 |
| Owen Beck | 6 | 55.9% | 54.0% | 53 | 44 | 54.6% | 4 | 4 | 50.0% | 1 | 0.48 |
| Florian Xhekaj | 8 | 32.1% | 60.0% | 69 | 59 | 53.9% | 5 | 5 | 50.0% | 1 | 0.91 |
| Alexandre Texier | 20 | 61.0% | 47.9% | 223 | 193 | 53.6% | 8 | 6 | 57.1% | 2 | 3.53 |
| Arber Xhekaj | 19 | 54.3% | 52.7% | 199 | 173 | 53.5% | 13 | 12 | 52.0% | 1 | 0.88 |
| Oliver Kapanen | 13 | 58.1% | 51.4% | 129 | 114 | 53.1% | 8 | 3 | 72.7% | 1 | 2.11 |
| Adam Engström | 13 | 61.0% | 48.3% | 144 | 128 | 52.9% | 13 | 6 | 68.4% | 1 | 0.84 |
| Cole Caufield | 20 | 57.4% | 47.4% | 281 | 255 | 52.4% | 15 | 12 | 55.6% | 8 | 5.10 |
| Phillip Danault | 20 | 62.7% | 44.0% | 227 | 207 | 52.3% | 9 | 5 | 64.3% | 1 | 2.42 |
| Jake Evans | 20 | 55.9% | 48.1% | 204 | 190 | 51.8% | 13 | 11 | 54.2% | 2 | 1.96 |
| Juraj Slafkovský | 20 | 56.0% | 47.5% | 271 | 255 | 51.5% | 11 | 8 | 57.9% | 1 | 2.93 |
| Josh Anderson | 19 | 57.0% | 38.9% | 211 | 222 | 48.7% | 15 | 10 | 60.0% | 8 | 4.11 |
| Kirby Dach | 18 | 45.4% | 50.0% | 143 | 157 | 47.7% | 11 | 7 | 61.1% | 1 | 1.83 |
| Chris Kreider | 19 | 51.3% | 41.6% | 191 | 215 | 47.0% | 16 | 10 | 61.5% | 2 | 2.17 |
| Mike Matheson | 9 | 49.4% | 43.4% | 131 | 148 | 47.0% | 9 | 6 | 60.0% | 0 | 0.32 |
| A. Carrier | 20 | 55.0% | 36.8% | 259 | 312 | 45.4% | 14 | 9 | 60.9% | 1 | 0.51 |
| Kaiden Guhle | 16 | 56.8% | 39.3% | 234 | 283 | 45.3% | 13 | 6 | 68.4% | 2 | 0.84 |
| Alex Newhook | 20 | 53.1% | 36.8% | 198 | 247 | 44.5% | 11 | 10 | 52.4% | 5 | 2.76 |
| Ivan Demidov* | 2 | 55.2% | — | 16 | 13 | 55.2% | 0 | 1 | 0.0% | 0 | 0.10 |
* Fewer than five games, so treat the numbers as a small sample.
Over the 20 games the best 5-on-5 attempt shares belong to Zachary Bolduc (57.4%), Lane Hutson (57.2%) and Nick Suzuki (56.0%), but all three were far better in the first ten games than in the last ten: Bolduc went from 68.0% to 47.5%, Hutson from 62.4% to 51.8% and Suzuki from 58.9% to 51.3%. At the other end Alex Newhook (44.5%), Kaiden Guhle (45.3%) and A. Carrier (45.4%) have the lowest shares among the regulars, and Chris Kreider (47.0%), Kirby Dach (47.7%) and Josh Anderson (48.7%) are also below the team’s 51.5%.
Several players carry goal numbers that do not match their shot numbers. Newhook is on the ice for 11 goals for and 10 against (52.4%) despite the lowest attempt share. Noah Dobson went from 4-9 in the first ten games to 7-3 in the last ten, and Dach was on the ice for 8 goals for and none against in Games 11 to 20. When a team shoots 13.9% and its goalie stops 94%, almost everyone looks good on goals, and the attempt column is the more honest one for the last ten games.
Coach’s note on the chances: Cole Caufield has 8 goals at 5-on-5 on 5.10 xG (+2.90) and Josh Anderson has 8 on 4.11 (+3.89), so both are finishing above their chances. Nick Suzuki (4 on 2.73) and Newhook (5 on 2.76) are above as well. On the other side, Alexandre Texier has 2 goals on 3.53 xG, Juraj Slafkovský 1 on 2.93, Phillip Danault 1 on 2.42 and Noah Dobson 0 on 1.57. Players who get good chances and miss are usually the first to turn the corner, so keep an eye on Texier and Slafkovský. The ones above their chances, Caufield and Anderson, are the ones who will have to keep finding more of them.
Goaltenders at 5-on-5
| Goalie | GP | 5-on-5 shots against | 5-on-5 goals against | 5-on-5 SV% | All-situations SV% | GSAx, GP 1-10 | GSAx, GP 11-20 | GSAx, Total (MoneyPuck) |
|---|---|---|---|---|---|---|---|---|
| Jacob Fowler | 12 | 251 | 16 | .936 | .926 | +3.3 | +5.4 | +8.7 |
| Jakub Dobeš | 8 | 150 | 17 | .887 | .852 | -6.2 | +5.0 | -1.2 |
| Team | 20 | 401 | 33 | .918 | .898 | -2.9 | +10.4 | +7.5 |
Fowler has faced 251 shots at 5-on-5 and given up 16 goals (.936), while Dobeš has faced 150 and given up 17 (.887). In the first ten games the 5-on-5 numbers were 76 shots and 7 goals for Fowler (.908) and 109 and 14 for Dobeš (.872). In Games 11 to 20 Fowler faced 175 and allowed 9 (.949), and Dobeš faced 41 and allowed 3 (.927). The team’s 5-on-5 save percentage went from 88.6% (26th) to 94.4% (3rd), and it is 91.8% (6th) after 20 games.
GSAx (goals saved above expected) adjusts for the quality of the shots a goalie faces, so it tells us whether the save percentage is the goalie or the shots. Fowler is at +8.7 after 20 games and Dobeš at -1.2, which puts the team at +7.5, with 10.4 of that coming in the last ten games. Dobeš’s number moved from -6.2 to -1.2 because of three good 5-on-5 starts, so the two goalies are a lot closer than they were after ten games. It is still a small sample, every site builds its expected-goals model differently, and the Games 11-20 column is the 20-game total minus the Games 1-10 numbers we published, so these are best read as a direction, not a final verdict.
How Player Grades Are Determined
The grades below are for Games 1 to 10 (as published in our 10-game report card), Games 11 to 20 and the full 20 games, and they run from A (outstanding) to D (poor). A player is graded for a block when he played enough games in it to judge, and players with fewer than five games over the 20 are not ranked. They are based on five things:
- Statistics and analytics: points, shots, plus-minus and the underlying shot numbers.
- Role and expectation: what the player is asked to do on his line or pair, and how he does against that.
- Consistency and game impact: whether he shows up every night and changes games.
- Coaching trust and usage: ice time, special teams and late-game situations.
- Growth and development: progress compared with last season, especially for the younger players.
Canadiens Report Card: Players Ranking
Forwards
| Player | GP | Grade, GP 1-10 | Grade, GP 11-20 | Grade, GP 1-20 |
|---|---|---|---|---|
| Nick Suzuki | 14 | A+ | A- | A |
| Cole Caufield | 20 | A | A | A |
| Juraj Slafkovský | 20 | B- | C | C+ |
| Josh Anderson | 19 | B | B | B |
| Zachary Bolduc | 20 | B | C+ | B- |
| Phillip Danault | 20 | B | C+ | B- |
| Jake Evans | 20 | C | B | B- |
| Chris Kreider | 19 | C | B- | C+ |
| Alex Newhook | 20 | C | B- | C+ |
| Oliver Kapanen | 13 | — | C+ | C+ |
| Alexandre Texier | 20 | C+ | C | C |
| Kirby Dach | 18 | D | B | C |
| Florian Xhekaj | 8 | — | C | C |
| Owen Beck | 6 | — | B | B |
Not ranked (fewer than five games over the 20): Ivan Demidov (2 GP) and David Reinbacher (1 GP). A dash means the player had fewer than five games in that block.
Defensemen
| Player | GP | Grade, GP 1-10 | Grade, GP 11-20 | Grade, GP 1-20 |
|---|---|---|---|---|
| Lane Hutson | 20 | A | A- | A |
| Noah Dobson | 20 | B | B | B |
| Alexandre Carrier | 20 | B | C | B- |
| Kaiden Guhle | 16 | B | A | A- |
| Arber Xhekaj | 19 | B | B | B |
| Mike Matheson | 9 | B- | — | B- |
| Adam Engström | 13 | B- | C+ | B- |
Goaltenders
| Player | GP | Grade, GP 1-10 | Grade, GP 11-20 | Grade, GP 1-20 |
|---|---|---|---|---|
| Jacob Fowler | 12 | A | A | A |
| Jakub Dobeš | 8 | D | C | C- |
Head Coach
| Coach | Grade, GP 1-10 | Grade, GP 11-20 | Grade, GP 1-20 |
|---|---|---|---|
| Martin St-Louis | B | B+ | B+ |
Team Grades
| Category | What the numbers say after 20 games | Grade, GP 1-10 | Grade, GP 11-20 | Grade, GP 1-20 |
|---|---|---|---|---|
| Overall | 12-4-4, 28 points, 2nd in the Atlantic, 4th in the East, 7th in the NHL; 51.5% of 5-on-5 shot attempts (9th) | B- | A- | B+ |
| Offense | 3.40 goals per game (10th), 27.8 shots per game (15th) | B- | B | B |
| Defense | 3.05 goals against per game (17th), 28.2 shots against per game (21st) | C- | C+ | C+ |
| Goaltending | .898 combined save percentage, 5-on-5 save percentage 91.8% (6th) | C- | A- | B |
| Power play | 8 for 60, 13.3% (31st) | D | D | D |
| Penalty kill | 60 for 77, 77.9% (16th) | B- | C- | C |
| Discipline | 90 minors (most in the NHL), net penalties -17 (31st) | D | C- | D+ |
Coaching Staff Evaluation: Martin St-Louis (B+)
A 12-4-4 record and 28 points after 20 games, five more than last season, and 7-1-2 in the last ten while the lineup kept changing: Suzuki missed six games, Matheson missed eleven in all, Demidov has missed 18 and Dach missed two. Fowler started 12 games and Dobeš 8, and the Canadiens went 5-0-2 in Fowler’s seven starts in Games 11 to 20. The staff also got the team to score first in six of the last ten games, after only three of the first ten.
The coaching questions are about habits, not talent. The team has taken the most minor penalties in the NHL (90), the power play is 31st at 13.3%, third periods are going against Montreal for the second block in a row (13 goals against in each), and the 5-on-5 attempt share fell to 46.6% in the last ten games, with 30.6 shots against per game (30th). In the positive column, the team is 7-1-1 on the road (5-0-0 in Games 11 to 20), 10-0-2 when leading after two periods, and 4-0-4 in games past regulation.
Final Thoughts
Four players stand out after 20 games. Cole Caufield leads the team with 12 goals and 19 points. Lane Hutson has 18 points and plays 24:54 a night. Jacob Fowler is 9-1-2 with a .926 save percentage and two shutouts. Nick Suzuki has 17 points in 14 games and had five points in five games after coming back from his injury. Josh Anderson (8 goals in 19 games) and Kirby Dach (+8 in the last block) are the depth surprises.
The concerns are the ones the numbers keep repeating, and one new one. Discipline is still among the worst in the league (the most minors, 90, and net penalties of -17, 31st), the power play is 8 for 60, and third periods have cost the team 26 goals against. The new one is the process: 46.6% of the 5-on-5 attempts and 30.6 shots against per game in the last ten games, held up by a PDO of 108.4 that will come down. If the percentages go back toward 100, the Canadiens need the shot numbers of the first ten games back to keep winning at this rate.
The next test is a road trip. Montreal plays at the Rangers on Monday (Nov. 16, 7:30 p.m. ET), at the Devils on Wednesday and at the Hurricanes on Thursday, and then hosts Philadelphia on Saturday. Matheson is day to day. Follow the Lineup Tonight and Injury Report pages for the latest, and our next report card will cover Games 21 to 30.
KEEP READING
- Avalanche Beat Canadiens 4-1, End 12-Game Point Streak
- Habs vs. Avalanche: Kreider Out, Xhekaj In, Dobeš Starts
- Canadiens Beat Bruins 5-2 as Depth Lines Lead the Way
- Matheson and Guhle Make the Difference for the Canadiens
- Canadiens 10-Game Report Card: Dominating Play, Penalty Problems
- Canadiens Stats of the Week
Sources: NHL game data (box scores, play-by-play, shift data, team and player statistics), NHL statistics for the first 20 games of 2025-26, and MoneyPuck (goals saved above expected, expected goals).
Get the Habs week in your inbox
Free weekly newsletter from HABSHQ.
More from HABSHQ
 Canadiens 10-Game Report Card: Dominating Play, Penalty ProblemsOctober 24, 2026
 Habs Monthly Report: October Wins, Power Play ProblemsNovember 1, 2026
 Evans Scores Twice, Including a Short-Hander, as Canadiens Beat Blackhawks 4-1October 24, 2026
 Habs vs. Jets: Fowler Starts, Same Lineup as SaturdayNovember 3, 2026
Watch the analysis
Coach Frenchy breaks down every Canadiens game live on the Hockey Nation Live Show, with the lines, the numbers and the plays that mattered.
Watch on YouTubeAbout Coach Frenchy
Coach Frenchy (Pierre) hosts the Hockey Nation Live Show, the daily live Canadiens and NHL commentary show on YouTube. HABSHQ is where he brings the lines, the numbers and the prospects together in one place.
Leave a Reply